May 7, 2026
May 7, 2026
How Salient’s Climate Modes Signaled Winter Storm Fern Two Weeks Out
Salient GemAI v3 now tracks the MJO, QBO, NAO, PNA, and stratospheric wind and their interplay signaled one of the deadliest US winter storms.
In late January 2026, Winter Storm Fern brought record-breaking cold, ice and heavy snow to the central and eastern United States, ranking among the deadliest US winter storms in recent memory. How early could a forecast model have flagged the risk? With the right climate-mode diagnostics in hand, the answer is more than two weeks.
Today we are announcing that Salient GemAI v3 now includes five climate-mode diagnostics: the Madden-Julian Oscillation (MJO), the Quasi-Biennial Oscillation (QBO), the North Atlantic Oscillation (NAO), the Pacific-North American pattern (PNA), and zonal-mean zonal wind at 100 hPa and 60°N. Together these represent the dominant modes of subseasonal-to-seasonal variability in the global atmosphere; and together they signaled the origins of Storm Fern weeks ahead. Here is how each signal contributed.
1. QBO: The Seasonal Stage-Setter
Entering winter 2025–26, the Quasi-Biennial Oscillation was in a strong descending easterly phase. This is a slow-moving seasonal-scale signal that may not grab headlines but is nevertheless a meaningful one: easterly QBO winters historically favor more frequent polar vortex disruptions and a trough-favored pattern across the central and eastern US.
Combined with a weak La Niña base state and an active MJO during early January, the QBO set the seasonal backdrop for above-normal stratospheric disruption risk. The stage was set.
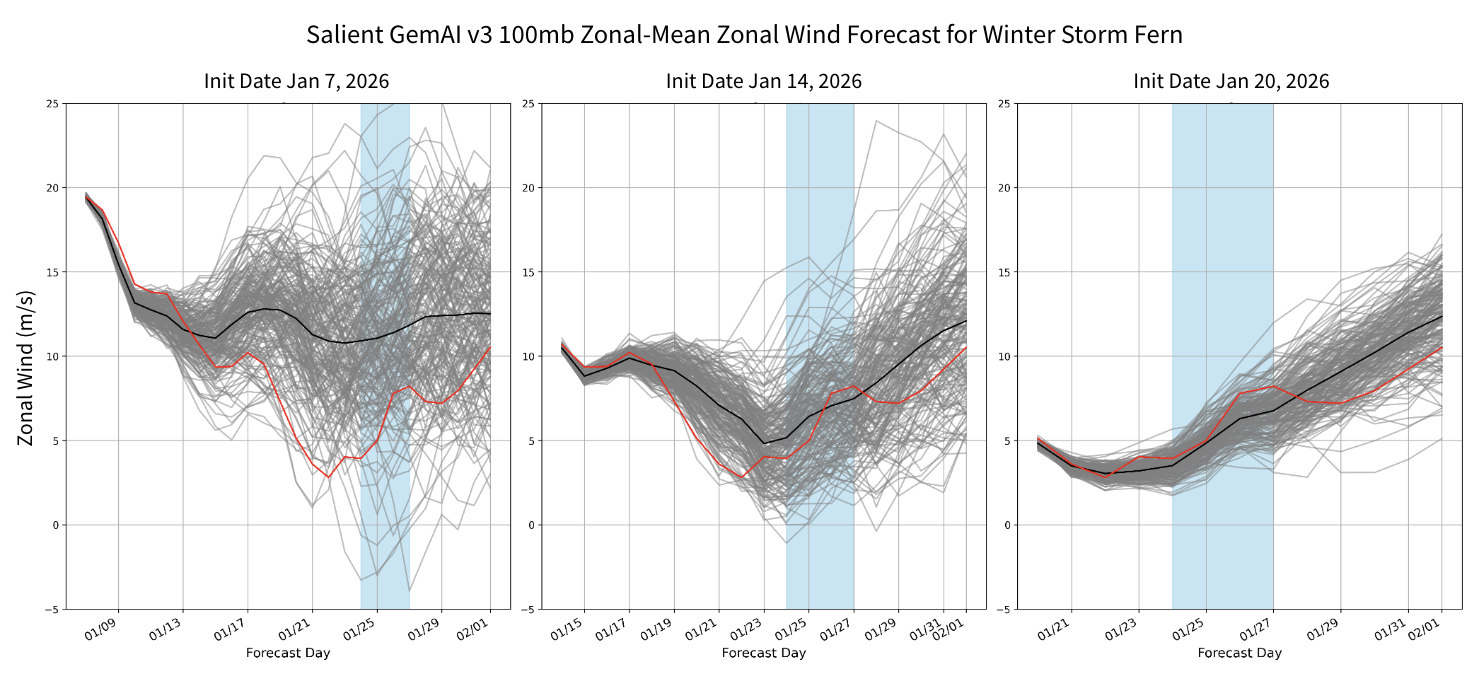
2. Zonal-Mean Zonal Wind: The Polar Vortex Weakens
By mid-January, the stratospheric polar vortex was elongated and displaced off the pole. While upper-level winds did not turn fully easterly, this displacement opened the door for downward coupling; a process by which stratospheric anomalies propagate into the troposphere over roughly 2–4 weeks. ERA5 data shows wind speeds decreasing from nearly 20 m/s in early January to just 3 m/s days prior to Fern.
GemAI v3’s 100 hPa zonal-mean zonal wind diagnostic tracked this evolution across three initialization dates (January 7, 14, and 20), with the ensemble mean progressively narrowing around the verifying ERA5 signal. All three initializations captured the overall weakening and although the ensemble mean was slightly too conservative, the ensemble distribution captures the possibility for significant weakening or complete wind-reversals. By the January 20th initialization, GemAI captures the stratospheric evolution, including the post-event recovery, quite well.
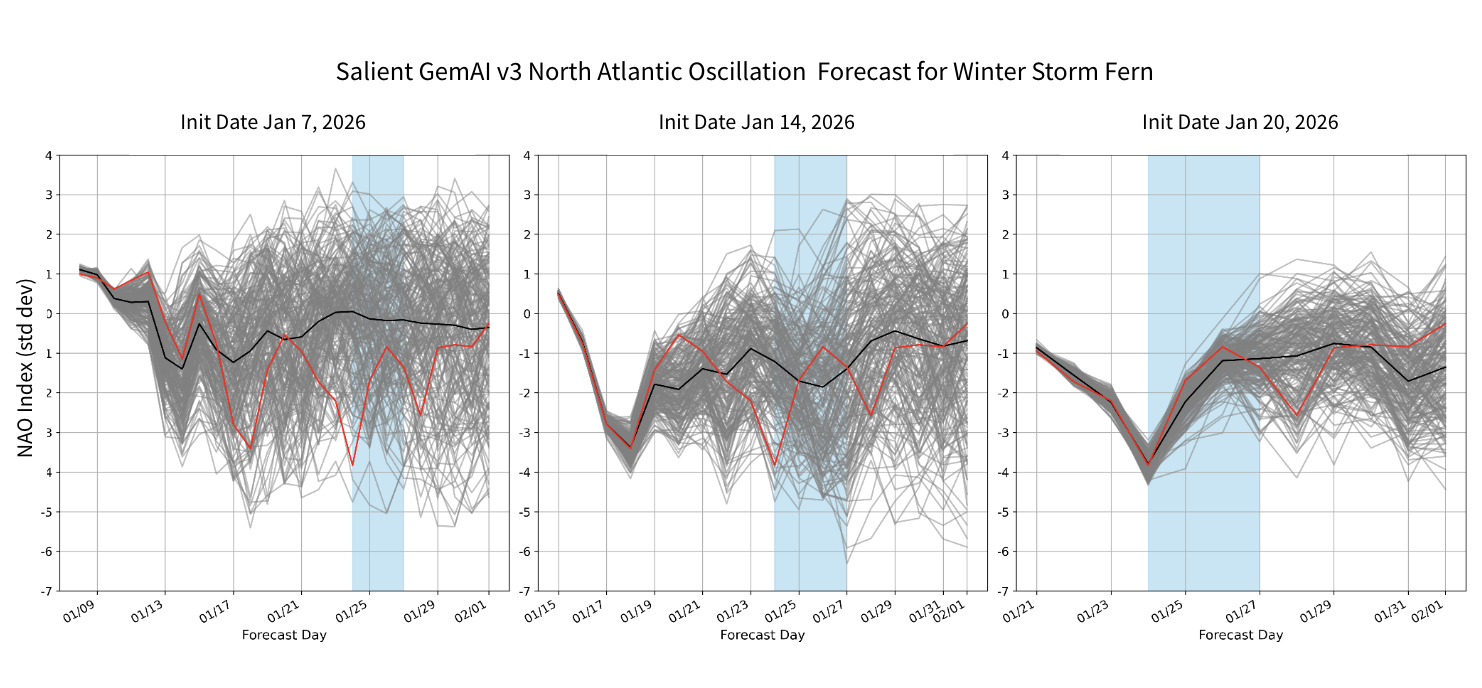
3. NAO: Greenland Blocking Opens the Arctic Corridor
The disrupted stratosphere coupled downward to a deeply negative NAO regime through mid-to-late January. ERA5 reanalysis shows the NAO reaching approximately −3.3σ on January 17, remaining between −1 and −3σ through the Fern window (January 24–27).
A strongly negative NAO can indicate large blocking high pressure over Greenland and an eastern North America trough; exactly the configuration that funnels Arctic air south through the central US. NAO carries meaningful forecast skill at two-week leads, making it one of the key diagnostic bridges between the stratospheric signal and surface impacts.
GemAI v3's NAO forecasts reflect this evolution clearly. From the January 7 initialization, more than two weeks ahead of Fern, the ensemble mean had already shifted negative through the storm window, and the verifying NAO trace tracked along the more strongly negative members of the distribution. By the January 14 initialization, the ensemble locked onto a deeply negative regime, with the mean settling near −1.5 to −2σ through the Fern window and the truth tracing the lower envelope of the spread. The January 20 initialization captured the sharp excursion to roughly −4σ on January 24 almost exactly, including the partial recovery toward neutral after the storm passed.
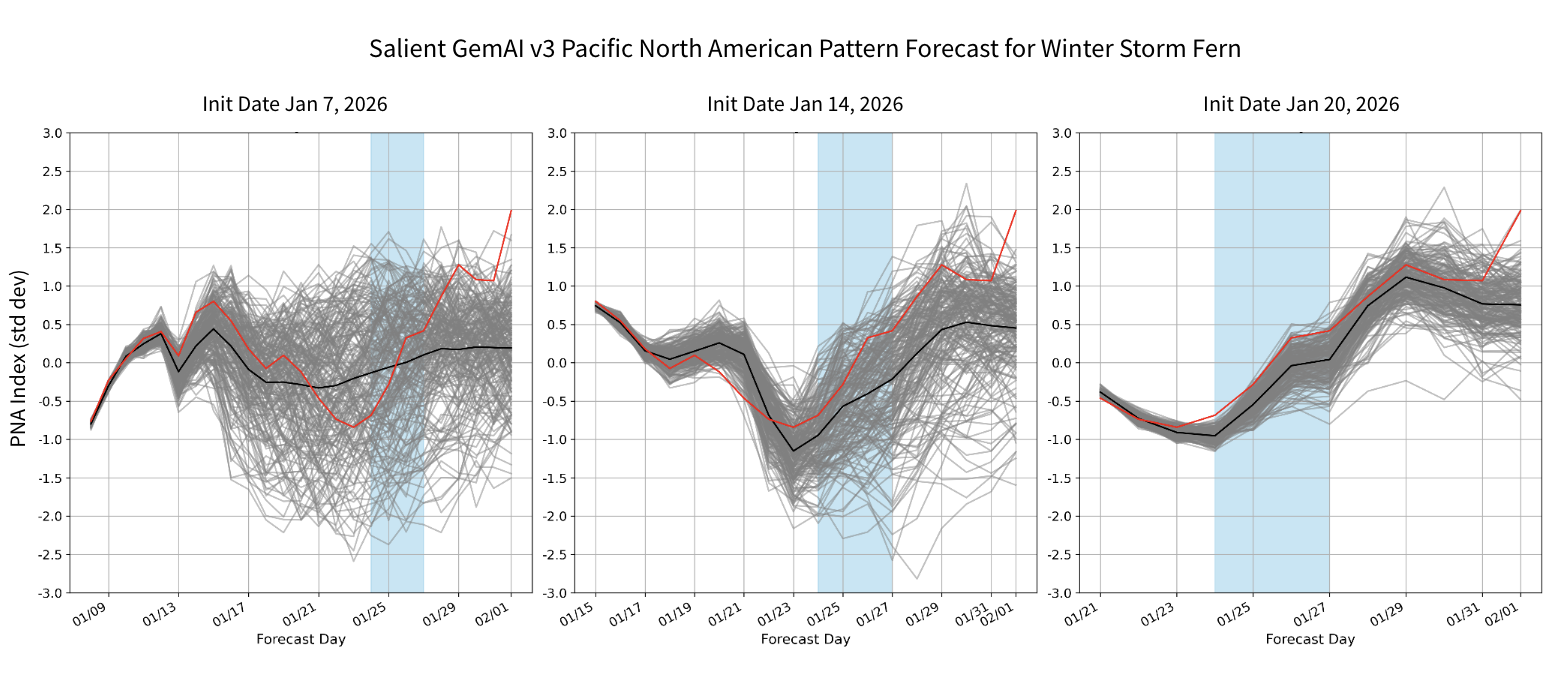
4. PNA: Beyond the Simple Composite
The PNA during Fern is a good reminder that teleconnection composites are summaries, not playbooks. The textbook line is "+PNA means a cold eastern US," and that's true on average, in the seasonal sense. But composites smooth over what actually happens during a single cyclogenesis event, where the index can swing through its full range in a matter of days.
Here, ERA5 has the PNA running slightly negative heading into the storm at about −0.8σ on January 23 as the Aleutian low deepened and the eastern Pacific went into pattern-amplification mode. Then as the wave progressed, the index steadily climbed, peaking near +1.7σ as the month ended with the western North American ridge amplifying and funnelling cold air down the Plains. So the +PNA showed up, it just showed up in the wake rather than the lead-up.
GemAI v3 captured this two-stage evolution with notable skill. The January 7 initialization had the ensemble mean near neutral through the storm window, with the truth tracking the upper edge of the spread as it climbed from negative to positive. By January 14, the ensemble cleanly resolved both the negative dip on January 23 and the rebound that followed. The January 20 run is essentially a direct hit — the mean and the verifying PNA are nearly on top of each other, including the sharp climb at the end of the month. That kind of fidelity matters, because the PNA flip here wasn't a slow regime shift; it was a fast dynamical response to cyclogenesis, and getting that right is harder than capturing a persistent signal.
5. MJO: The Tropical Reinforcer
Throughout the Fern window, the MJO was in Phase 7 (Western Pacific) at moderate amplitude. Phase 5–7 occupancy in boreal winter has a well-known downstream signature: trough development over the eastern US about two weeks later, here aligning almost exactly with Storm Fern’s timing.
Rather than being the dominant driver, the MJO acted as a constructive background contributor, reinforcing the stratospheric and NAO signals through an independent tropical pathway. When multiple independent signals all point in the same direction, forecast confidence rises substantially.
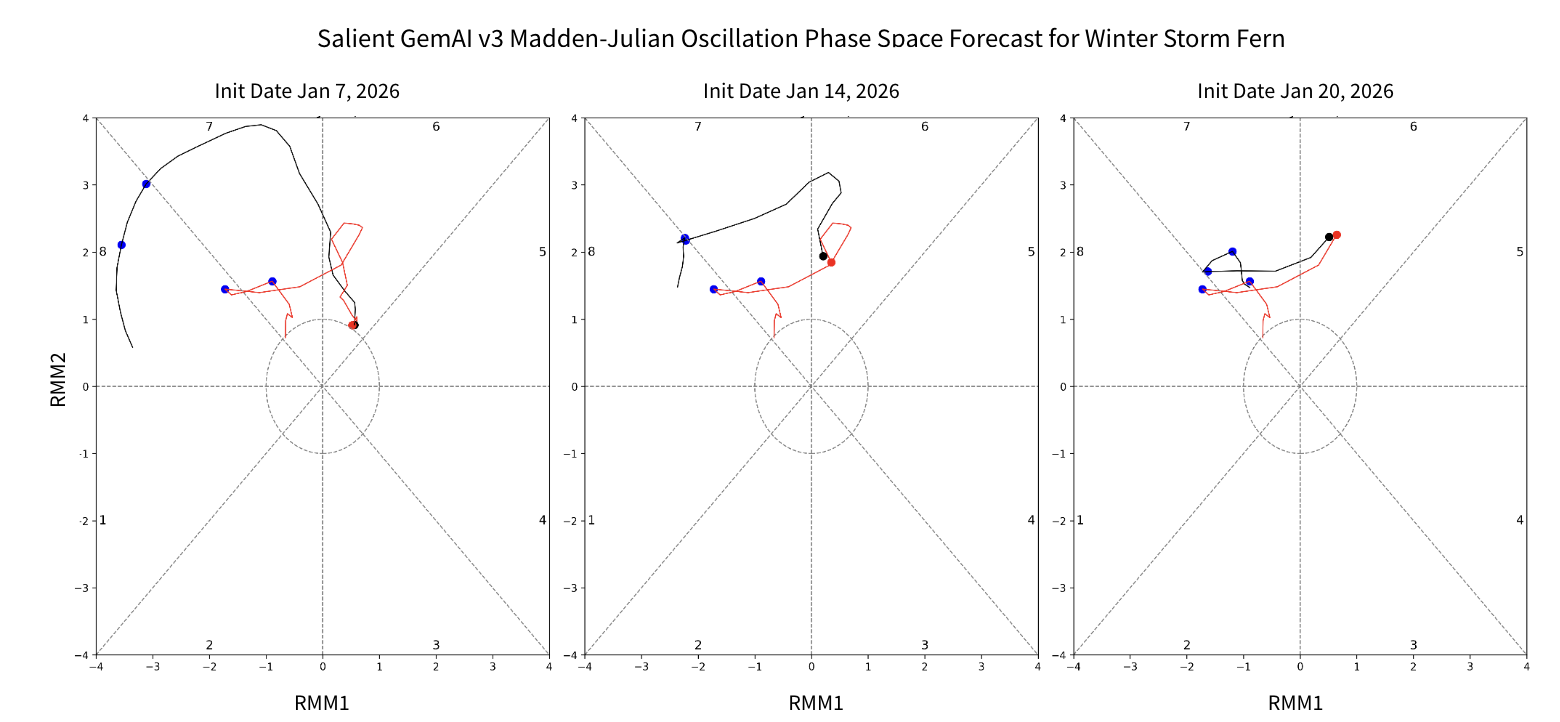
The January 7 initialization, two weeks out, correctly placed the MJO in deep Phase 7 at Fern's strike, though it overshot the amplitude — the ensemble peaked near 4 versus a verifying value closer to 3. The January 14 and January 20 runs both landed close to the verifying RMM track in both phase and amplitude.
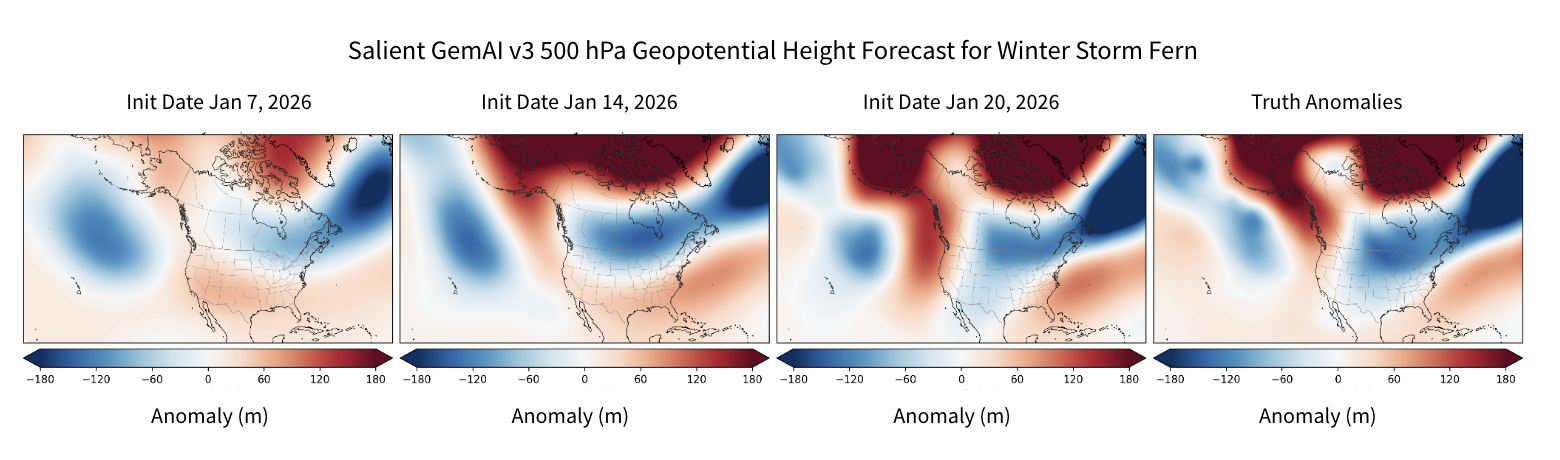
Putting It Together: The 500 hPa Pattern
Climate indices are useful shorthand, but they're summarizing something physical, and the 500 hPa height anomaly field over the Fern window is where that physics shows up in plain view.
The verifying ERA5 anomalies show a sprawling region of positive height anomalies stretching from Alaska across northern Canada to Greenland; the high-latitude blocking that the negative NAO and disrupted polar vortex both describe. A deep trough over the central US, directly sourced from this blocking, provided the Arctic-air corridor that Fern exploited. A secondary trough center over Hudson Bay and Labrador completed the pattern.
GemAI v3 built toward this configuration progressively across the three initializations:
- January 7 (18+ days out): the right pattern is already there in qualitative terms — high-latitude blocking, central US trough, Aleutian low — but everything is muted in amplitude. You'd look at this map and know what regime to expect, even if you wouldn't yet bet on the magnitude.
- January 14 (10+ days out): the Alaska–Canada block fills in at full strength, the central trough deepens, and the Hudson Bay center takes shape. By this point the forecast is operationally actionable.
- January 20 (4–7 days out): essentially indistinguishable from ERA5 in both structure and magnitude.
Overall, the large-scale regime locked in early, with amplitude and detail sharpening as the event approached. It mirrors how a forecaster's confidence builds in real time: first you recognize the pattern, then you trust the magnitude, then you commit to the impacts.
What This Means for Forecasters
The Storm Fern case illustrates the value of monitoring multiple independent climate signals simultaneously. No single index told the whole story; rather, each captured a different piece of the puzzle on a different timescale. The QBO set the seasonal background, biasing the winter toward stratospheric disruption. The 100 hPa zonal wind then tracked the polar vortex in real time as it weakened. That weakening coupled downward into a deeply negative NAO, opening the Arctic-air corridor through eastern North America, while the MJO's persistence in Phase 7 provided independent tropical reinforcement of the same downstream trough. Finally, the PNA captured the storm-scale pattern flip as cyclogenesis unfolded. Each signal operates on a different timescale and through a different physical pathway, but together they pointed at the same outcome — and that convergence is precisely what builds forecast confidence at extended range.
GemAI v3’s new climate-mode diagnostics bring all five of these signals into a single operational framework, enabling the kind of multi-signal synthesis that produces confident forecasts at extended range.
Free product trials (for qualified teams)
We offer free product trials for qualified teams interested in evaluating Salient GemAI forecasts out to 126 days.
We’re prioritizing trials for teams with clear operational decision workflows — including teams that can evaluate calibration, tail risk, and downstream decision value in real settings.
Request access: https://www.salientpredictions.com/request-a-demo
May 7, 2026
May 7, 2026
How Salient’s Climate Modes Signaled Winter Storm Fern Two Weeks Out
Salient GemAI v3 now tracks the MJO, QBO, NAO, PNA, and stratospheric wind and their interplay signaled one of the deadliest US winter storms.
In late January 2026, Winter Storm Fern brought record-breaking cold, ice and heavy snow to the central and eastern United States, ranking among the deadliest US winter storms in recent memory. How early could a forecast model have flagged the risk? With the right climate-mode diagnostics in hand, the answer is more than two weeks.
Today we are announcing that Salient GemAI v3 now includes five climate-mode diagnostics: the Madden-Julian Oscillation (MJO), the Quasi-Biennial Oscillation (QBO), the North Atlantic Oscillation (NAO), the Pacific-North American pattern (PNA), and zonal-mean zonal wind at 100 hPa and 60°N. Together these represent the dominant modes of subseasonal-to-seasonal variability in the global atmosphere; and together they signaled the origins of Storm Fern weeks ahead. Here is how each signal contributed.
1. QBO: The Seasonal Stage-Setter
Entering winter 2025–26, the Quasi-Biennial Oscillation was in a strong descending easterly phase. This is a slow-moving seasonal-scale signal that may not grab headlines but is nevertheless a meaningful one: easterly QBO winters historically favor more frequent polar vortex disruptions and a trough-favored pattern across the central and eastern US.
Combined with a weak La Niña base state and an active MJO during early January, the QBO set the seasonal backdrop for above-normal stratospheric disruption risk. The stage was set.
2. Zonal-Mean Zonal Wind: The Polar Vortex Weakens
By mid-January, the stratospheric polar vortex was elongated and displaced off the pole. While upper-level winds did not turn fully easterly, this displacement opened the door for downward coupling; a process by which stratospheric anomalies propagate into the troposphere over roughly 2–4 weeks. ERA5 data shows wind speeds decreasing from nearly 20 m/s in early January to just 3 m/s days prior to Fern.
GemAI v3’s 100 hPa zonal-mean zonal wind diagnostic tracked this evolution across three initialization dates (January 7, 14, and 20), with the ensemble mean progressively narrowing around the verifying ERA5 signal. All three initializations captured the overall weakening and although the ensemble mean was slightly too conservative, the ensemble distribution captures the possibility for significant weakening or complete wind-reversals. By the January 20th initialization, GemAI captures the stratospheric evolution, including the post-event recovery, quite well.
3. NAO: Greenland Blocking Opens the Arctic Corridor
The disrupted stratosphere coupled downward to a deeply negative NAO regime through mid-to-late January. ERA5 reanalysis shows the NAO reaching approximately −3.3σ on January 17, remaining between −1 and −3σ through the Fern window (January 24–27).
A strongly negative NAO can indicate large blocking high pressure over Greenland and an eastern North America trough; exactly the configuration that funnels Arctic air south through the central US. NAO carries meaningful forecast skill at two-week leads, making it one of the key diagnostic bridges between the stratospheric signal and surface impacts.
GemAI v3's NAO forecasts reflect this evolution clearly. From the January 7 initialization, more than two weeks ahead of Fern, the ensemble mean had already shifted negative through the storm window, and the verifying NAO trace tracked along the more strongly negative members of the distribution. By the January 14 initialization, the ensemble locked onto a deeply negative regime, with the mean settling near −1.5 to −2σ through the Fern window and the truth tracing the lower envelope of the spread. The January 20 initialization captured the sharp excursion to roughly −4σ on January 24 almost exactly, including the partial recovery toward neutral after the storm passed.
4. PNA: Beyond the Simple Composite
The PNA during Fern is a good reminder that teleconnection composites are summaries, not playbooks. The textbook line is "+PNA means a cold eastern US," and that's true on average, in the seasonal sense. But composites smooth over what actually happens during a single cyclogenesis event, where the index can swing through its full range in a matter of days.
Here, ERA5 has the PNA running slightly negative heading into the storm at about −0.8σ on January 23 as the Aleutian low deepened and the eastern Pacific went into pattern-amplification mode. Then as the wave progressed, the index steadily climbed, peaking near +1.7σ as the month ended with the western North American ridge amplifying and funnelling cold air down the Plains. So the +PNA showed up, it just showed up in the wake rather than the lead-up.
GemAI v3 captured this two-stage evolution with notable skill. The January 7 initialization had the ensemble mean near neutral through the storm window, with the truth tracking the upper edge of the spread as it climbed from negative to positive. By January 14, the ensemble cleanly resolved both the negative dip on January 23 and the rebound that followed. The January 20 run is essentially a direct hit — the mean and the verifying PNA are nearly on top of each other, including the sharp climb at the end of the month. That kind of fidelity matters, because the PNA flip here wasn't a slow regime shift; it was a fast dynamical response to cyclogenesis, and getting that right is harder than capturing a persistent signal.
5. MJO: The Tropical Reinforcer
Throughout the Fern window, the MJO was in Phase 7 (Western Pacific) at moderate amplitude. Phase 5–7 occupancy in boreal winter has a well-known downstream signature: trough development over the eastern US about two weeks later, here aligning almost exactly with Storm Fern’s timing.
Rather than being the dominant driver, the MJO acted as a constructive background contributor, reinforcing the stratospheric and NAO signals through an independent tropical pathway. When multiple independent signals all point in the same direction, forecast confidence rises substantially.
The January 7 initialization, two weeks out, correctly placed the MJO in deep Phase 7 at Fern's strike, though it overshot the amplitude — the ensemble peaked near 4 versus a verifying value closer to 3. The January 14 and January 20 runs both landed close to the verifying RMM track in both phase and amplitude.
Putting It Together: The 500 hPa Pattern
Climate indices are useful shorthand, but they're summarizing something physical, and the 500 hPa height anomaly field over the Fern window is where that physics shows up in plain view.
The verifying ERA5 anomalies show a sprawling region of positive height anomalies stretching from Alaska across northern Canada to Greenland; the high-latitude blocking that the negative NAO and disrupted polar vortex both describe. A deep trough over the central US, directly sourced from this blocking, provided the Arctic-air corridor that Fern exploited. A secondary trough center over Hudson Bay and Labrador completed the pattern.
GemAI v3 built toward this configuration progressively across the three initializations:
- January 7 (18+ days out): the right pattern is already there in qualitative terms — high-latitude blocking, central US trough, Aleutian low — but everything is muted in amplitude. You'd look at this map and know what regime to expect, even if you wouldn't yet bet on the magnitude.
- January 14 (10+ days out): the Alaska–Canada block fills in at full strength, the central trough deepens, and the Hudson Bay center takes shape. By this point the forecast is operationally actionable.
- January 20 (4–7 days out): essentially indistinguishable from ERA5 in both structure and magnitude.
Overall, the large-scale regime locked in early, with amplitude and detail sharpening as the event approached. It mirrors how a forecaster's confidence builds in real time: first you recognize the pattern, then you trust the magnitude, then you commit to the impacts.
What This Means for Forecasters
The Storm Fern case illustrates the value of monitoring multiple independent climate signals simultaneously. No single index told the whole story; rather, each captured a different piece of the puzzle on a different timescale. The QBO set the seasonal background, biasing the winter toward stratospheric disruption. The 100 hPa zonal wind then tracked the polar vortex in real time as it weakened. That weakening coupled downward into a deeply negative NAO, opening the Arctic-air corridor through eastern North America, while the MJO's persistence in Phase 7 provided independent tropical reinforcement of the same downstream trough. Finally, the PNA captured the storm-scale pattern flip as cyclogenesis unfolded. Each signal operates on a different timescale and through a different physical pathway, but together they pointed at the same outcome — and that convergence is precisely what builds forecast confidence at extended range.
GemAI v3’s new climate-mode diagnostics bring all five of these signals into a single operational framework, enabling the kind of multi-signal synthesis that produces confident forecasts at extended range.
Free product trials (for qualified teams)
We offer free product trials for qualified teams interested in evaluating Salient GemAI forecasts out to 126 days.
We’re prioritizing trials for teams with clear operational decision workflows — including teams that can evaluate calibration, tail risk, and downstream decision value in real settings.
Request access: https://www.salientpredictions.com/request-a-demo
About Salient
Salient combines ocean and land-surface data with machine learning and climate expertise to deliver accurate and reliable subseasonal-to-seasonal weather forecasts and industry insights—two to 52 weeks in advance. Bringing together leading experts in physical oceanography, climatology and the global water cycle, machine learning, and AI, Salient helps enterprise clients improve resiliency, increase preparedness, and make better decisions in the face of a rapidly changing climate. Learn more at www.salientpredictions.com and follow on LinkedIn and X.
Contact:
No items found.